on a psychrometric chart.
Brian R. Strobel
Extension Associate
Richard R.
Stowell
Assistant Professor
|
|---|
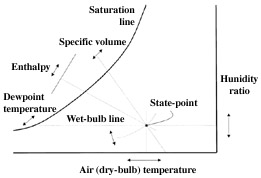
| Figure 1. Locating air properites on a psychrometric chart. |
Air conditions can be quickly characterized by using a special graph called a psychrometric chart. Properties on the chart include dry-bulb and wet-bulb temperatures, relative humidity, humidity ratio, specific volume, dewpoint temperature, and enthalpy (see Figure 1).
Only two properties are needed to characterize air because the point of intersection of any two property lines defines the state-point of air on a psychrometric chart. Once this point is located on the chart, the other air properties can be read directly. Air properties at 29.92 in. Hg. (standard) atmospheric pressure can be found using the enclosed psychrometric chart (Figure 2. A psychrometic chart.). Put a laminated version of this chart on a wall at your facility for handy reference.
Dry-bulb temperature, which is usually referred to as simply air temperature, is the air property that is most familiar. Dry-bulb temperature, Tdb, can be measured using a standard thermometer or more sophisticated sensors. This temperature is an indicator of heat content and is shown along the bottom axis of the psychrometric chart. The vertical lines extending upward from this axis are constant-temperature lines.
Relative humidity, RH, is the ratio of the actual water vapor pressure, Pv, to the vapor pressure of saturated air at the same temperature, Pvs, expressed as a percentage. Relative humidity is a relative measure, because the moisture-holding capacity of air increases as air is warmed. In practice, relative humidity indicates the moisture level of the air compared to the airs moisture-holding capacity. Relative humidity lines are shown on the chart as curved lines that move upward to the left in 10% increments. The line representing saturated air (RH = 100%) is the uppermost curved line on the chart.
Wet-bulb temperature, Twb, represents how much moisture the air can evaporate. This temperature is often measured with a common mercury thermometer that has the bulb covered with a water-moistened wick and with a known air velocity passing over the wick. On the chart, the wet-bulb lines slope a little upward to the left, and this temperature is read at the saturation line.
Dewpoint, Tdp, is the temperature at which water vapor starts to condense out of air that is cooling. Above this temperature, the moisture stays in the air. This temperature is read by following a horizontal line from the state-point (found earlier) to the saturation line.
Specific volume represents the space occupied by a unit weight of dry air, in ft3/lb, and is equal to 1/air density. Specific volume is shown along the bottom axis of a psychrometric chart, with constant-volume lines slanting upward to the left.
Humidity ratio, w, is the dry-basis moisture content of air expressed as the weight of water vapor per unit weight of dry air. Humidity ratio is indicated along the right-hand axis of a psychrometric chart.
Enthalpy, h, is the measure of airs energy content per unit weight (Btu/lbda). Wet-bulb temperature and enthalpy are related intuitively. So, enthalpy is read from where the appropriate wet-bulb line crosses the diagonal scale above the saturation curve.
 |
|---|
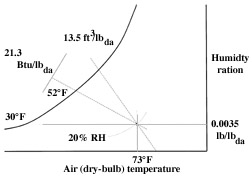
| Figure 3. Properties of moist air at 73 degrees F and 20% RH as found on a psychromatic chart. |
Figure 3 illustrates properties of air at 73 degrees F (Tdb) and 20% RH. By using the psychrometric chart, wet-bulb temperature is 52 degrees F; enthalpy is 21.3 Btu/lbda; humidity ratio is 0.0035 lb/lbda; dewpoint temperature is 30 degrees F; and specific volume is 13.5 ft3/lbda.
MWPS. 1983. Structures and Environment Handbook. Eleventh Edition. MWPS-1. pp. 602.1-602.10. Midwest Plan Service. Iowa State University, Ames, IA.
MWPS. 1989. Natural Ventilating Systems for Livestock Housing. MWPS-33. p. 21. Midwest Plan Service. Iowa State University, Ames, IA.
Reviewed by: Joe Beiler, Mercer Co. Extension; Mike Lichtensteiger, Food, Agricultural, and Biological Engineering; Steve Ruhl, Morrow Co. Extension.